What is the CPS Opportunity Index?
The CPS Opportunity Index is a tool that uses indicators to analyze differences in access to opportunity. This tool is one of the ways CPS makes operational and funding decisions to ensure those most impacted by inequity have the resources and conditions necessary for strong, vibrant, and healthy school communities.
Equity Lens
At CPS, we apply an Equity Lens to all of the work we do. It enables us to see and understand the existing structures and conditions that create inequities, as well as the changes that are necessary to create more equitable learning environments so ALL students can achieve universal goals.
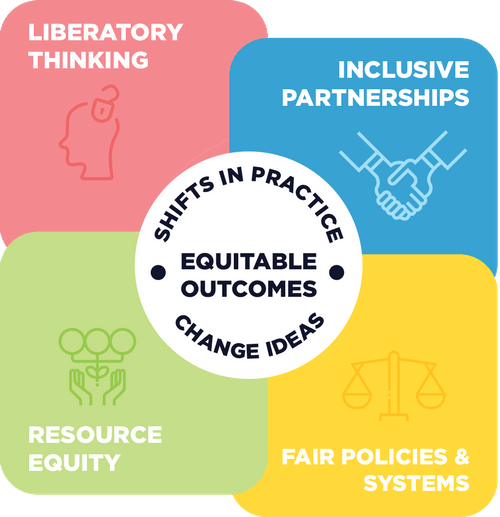
Resource Equity
The goal of resource equity is to create equitable student experiences for every child. Resource equity means consistently prioritizing and allocating people, time, and money to align with levels of need and opportunity.
CPS Opportunity Index Individual School Scores
Total Indicator Score: The sum of each of the indicator scores. Schools range from 14 (lowest need) to 53 (highest need) out of a possible 60 points.
Opportunity Index Score: The values for each metric are ranked by percentile and assigned a point value between 1 and 5. Scores for each metric are then averaged to produce a composite Opportunity Index Score, based on a scale of 1.0 to 5.0, with 1.0 indicating having the most opportunity, and 5.0 being furthest from opportunity.
Unless otherwise noted, indicators are based on 20th day School Enrollment of the current year
| Community Factors | |
|---|---|
| Average Community Student Hardship Index | Chicago Community Area Hardship Index (2016-2020) developed by UIC. Average Community Area Hardship Index (based on the community area that students attending the school reside in) |
| % of students residing in INVEST SouthWest neighborhoods |
Percent of students at a given school who reside in one of the city's INVEST South/West community areas |
| Average Community Life Expectancy | Life Expectancy Data (2020): Average life expectancy (based on the community area that students attending the school reside in) |
| School Demographics | |
|---|---|
| % Diverse Learner Population | Percent of diverse learner population (LRE 1, 2, or 3) |
| % Economically Disadvantaged | Percent of students qualifying for Free or Reduced Lunch |
| % English Language Learners | Percent Limited English Proficiency of attending students |
| % Medicaid Underenrollment | Percent of students enrolled (eligible) in FRL but not enrolled in Medicaid |
| % STLS | Percent of students in temporary living situations (homeless) |
| Teacher Turnover | Identifies teachers in school-level teacher rosters as of Nov 1 of base FY23 and not on the following Nov 1 FY24 roster (includes teachers who have transferred to other schools and those who have left the district) |
| >90% Majority One Race/Ethnicity | Indicates whether a school has a student population over 90% single race or ethnicity |
| Historical School Funding | |
|---|---|
| School Budget & Changes in School Budgets Funding Index Score: A |
Average of A1 and A2 A1. SY18-SY20 School Budgets 1 to 5 scale A2. School Budget Change (SY20 vs SY19) 1 to 5 scale |
| Capital & TIF Funding Funding Index Score: B |
Total Capital Investment (2010-2019) + TIF (1999-2019) 1 to 5 scale |